
Predicted Energy Model
The predicted energy model estimates the energy a solar facility will generate using a typical meteorological year (TMY) dataset. The financial model assumes this prediction, which is based on historical weather trends. Denowatts uses the predicted energy model to calculate the following performance index as defined by the IEC (IEC TS 61724-3:2016 Section 3, & IEC 61724-1:2017 Section 10)
The Baseline Energy Performance Index (BEPI) - the ratio of Measured Energy to Predicted Energy. BEPI is most critical to understanding the financial bottom line of solar performance:
-
“Are we seeing the asset profitability that we predicted?”
-
“Did we model the right assumptions about typical solar resources?”
Documentation
To track the BEPI accurately, it is important that Denowatts uses the correct model for comparison. A few things to note on the predicted model:
-
Also called the Pro-Forma model, this model is intended for long-term financial analysis
-
For a more accurate predicted model, the following assumptions should be included
-
Soiling and shade loss estimates
-
System unavailability loss estimates
-
Ensure the model's energy endpoint aligns correctly with the metering point in the Denowatts portal.
-
Sometimes these models include Medium-voltage (MV) line and transformer losses, but the main production meter available in the DAS is low-voltage (LV), which causes minor variations.
-
Utility billing meters are typically not monitored by the system's DAS and may show minor variations depending on how far downstream they are from the meter in the system's DAS.
-
-
-
Denowatts portal automatically derates these values (0.5%/year) for age, starting with the site's operation date.
-
Denowatts reports Predicted Energy against Proxy Model Simulations reconstructed from the Investor’s Model, combined with the site’s Degradation Schedule (see Model Management).
How to Upload
-
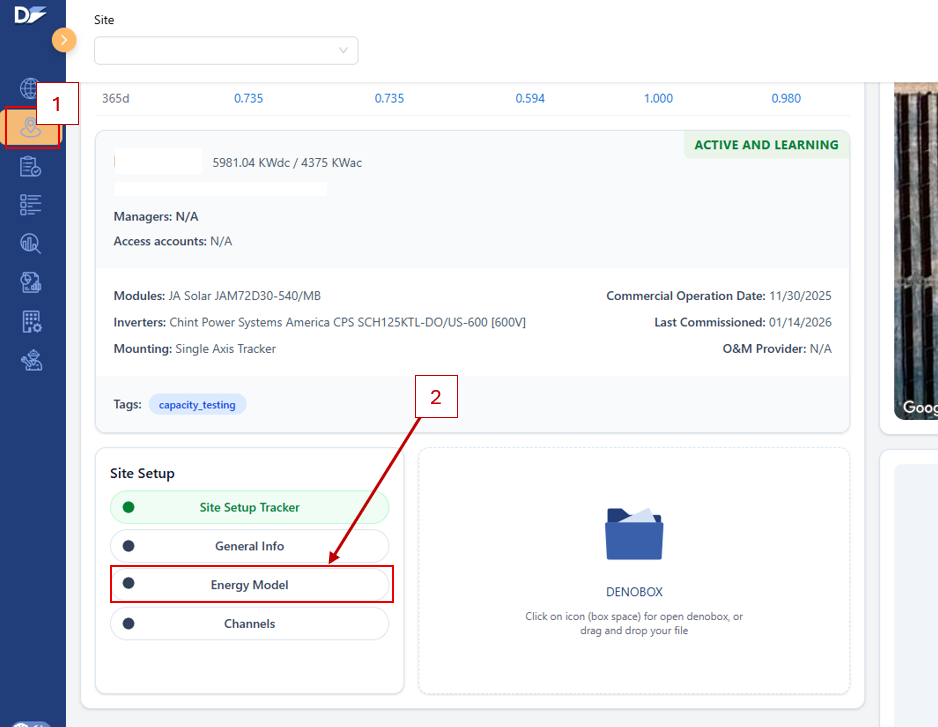
Navigate to the Sites Overview Page
-
Click on Energy Model
-
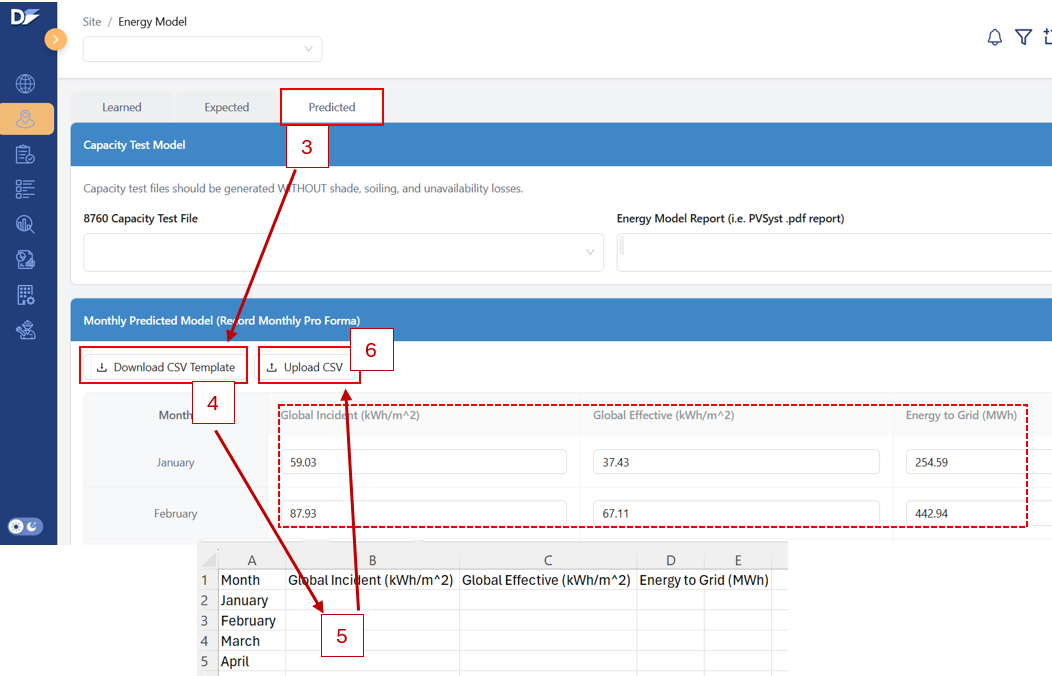
Click the "Predicted" tab
-
Download CSV Template or populate the table manually
-
Add GlobInc (kWh/m^2), GlobEff (kWh/m^2), and E_Grid (MWh) values to the CSV template.
-
Upload Template
- Please also upload the complete predicted model to the Denobox
Where to View the Baseline Energy Performance Index (BEPI)
-
Site Power Analysis Dashboard (KPI Section)
-
Site Overview Page (KPI Section)
-
Report Builder
Learn More
- Models & Benchmarks: the Investor’s Model and how Predicted relates to Expected, Forecasted, and Learned.
- Model Management: how the Predicted Simulations are reconstructed as Proxy Model Simulations.
- PVsyst Upload
Last updated on